Current Event: Coffee and diabetes studies
Science Daily: Long-Term Coffee Consumption Significantly Reduces Type 2 Diabetes Risk Coffee: A new miracle drug for diabetics?
2. Jan 13. Evidence
driven education readings.
School Effects, Basic Regression relations for multilevel data,
Slopes as outcomes.
Data
Adventure #1. Multilevel school data taken from the MlWin
manual.
Data mlwinschool.dat contains
4059 rows (students) residing in 65 schools.
The sequence of the
variables and the coding are as follows:
col 1. school: school identifiers
col 2. student: student identifiers
col 3. normexam: the exam score obtained by each student at age 16
col 4. cons: a column of 1's
col 5. standlrt: score for each student at age 11 on the London reading test
col 6. gender: student gender, 0=boy, 1=girl
col 7. schgend: school gender, 1=mix gender school, 2=boy school, 3=girl school
col 8. avslrt: coded as 1, 0, 1
col 9. schav: this variable is constructed by taking the average intake ability
(standlrt) for each school. The bottom 25% of the schools are coded as
1=low,
the middle
50% are coded as 2=mid, and the top 25% are coded as 3=high
col 10. vrband: coded as 1, 2, 3
For the data in Adventure 1, use normexam as outcome and standirt (pretest)
as predictor.
If you like use only the first ten schools (out of 65) to reduce work.
Obtain the within-school regressions
Obtain directly the three regression slopes discussed in
contextual analysis: total (individual); between-school; within-school
pooled (relative standing). Verify the Duncan-Cuzort-Duncan relationship.
Verify the relations for
what
Kreft terms the contextual regression model (regression of Y on
X and Xbar) and for the Cronbach model (regression of Y on X-bar and
X - Xbar).
Evidence driven education readings.
Data Adventure #1 discussion
Derivation Contentual Effects Relations (DCD)
Current Event : Vitamins and Alzheimer's
Science Daily: Vitamin Supplement Use May Reduce Effects Of Alzheimer's Disease Pravda: Vitamins E & C to fight Alzheimer's
Analysis of Covariance and Comparing Regressions.
Equivalence to HLM (High School and Beyond) Analyses; HLM example
Introduction to Path Analysis and Structural Equation Models Ed257 path example
Text Readings Kline Chap. 3, Chap 5 (esp 5.8, 5.10)
Current Event: Sleep and Math Performance
BBC: Sleep 'can increase brain power' Nature: Sleep boosts lateral thinking
Multiple Regression Parameters (Mosteller & Tukey exs)
Measurement error and regression; multiple regression estimates via normal eqs (path anal);
Path analysis examples (Freedman notes and paper);
Intro to structural equation models (Allison notes); notation and estimation handout;
Text Readings Kline Chap. 7, Chap 8
Data
Adventure # 2
[for Feb 10 class
mtg]
HSB data from Bryk-Raundenbush, Singer
The High School and Beyond data set (HSB) is provided in the course directory.
The HSB data is used in the HLM book and manual in the two Singer papers and
in the SSI HLM tutorial.
The level 1 (student file) is HSB1.dat and the level 2 (school file) is HSB2.dat
path: /usr/class/ed260/HSB*.dat or /afs/ir.stanford.edu/class/ed260/HSB*.dat
Level-1 file. For our example data the level-1 file has 7185
cases and four variables (not including the school ID).
In hsb1.dat the columns are
School ID,
minority (an indicator for student ethnicity
1 = minority, 0 = other)
female (an indicator for student gender 1 female, 0 = male),
ses, (a standardized
scale constructed from variables measur-ing parental education, occupation,
and income)
mathach (a measure of mathematics achievement)
In hsb2.dat, which contains 160 schools with 6 variables per school, the columns
are
School ID, size (school enrollment), sector
(1 = Catholic, 0 = public),
pracad (proportion of students
in the academic track),
disclim (a scale measuring disciplinary
climate)
himnty (I = more than 40% minority enrollment, 0 = less
than 40%),
meanses (mean of the SES values for the students in
this school who are included in the level-i file;
typical of the HLM guys these
don't match exactly)
a. replicate the standard HLM Levet 1/Level 2 analysis using cSES as Level
1 predictor and SES, Sector as Level 2 predictors shown for example in
Singer
pp.336-338
or HLM example at SSI site. BR text Ch4, results Table 4.5.
Use HLM or SAS Proc Mixed for computing.
b. try the "Minitab" equivalent (Minitab is a proxy for any simple
regression program). Two separate approaches which can be compared.
First, fit 160 within-school regressions. Use intercept and slope parameter
estimates as outcome variables for Level 2 predictors
Second, fit one large regression model--eq 8b Singer p.337--to 7185 cases (substitute
level 2 eqs into level 1 model for mathach to make one large regression model).
See BR text, eqs 4.21-4.22, p.80.
Compare results from parts a and b.
c. similar to part b. show equivalence of level 2 intercept results to an analysis
of covariance on school means using SES as covariate. Compare HLM level-2 slopes
analysis to a contextual effects analysis (total, between, within) done separately
for public and private, contrasting relative standing coeffs for the two school
types.
Data Adventure # 3 [for Feb. 10 class] (From Paul Allison course notes)
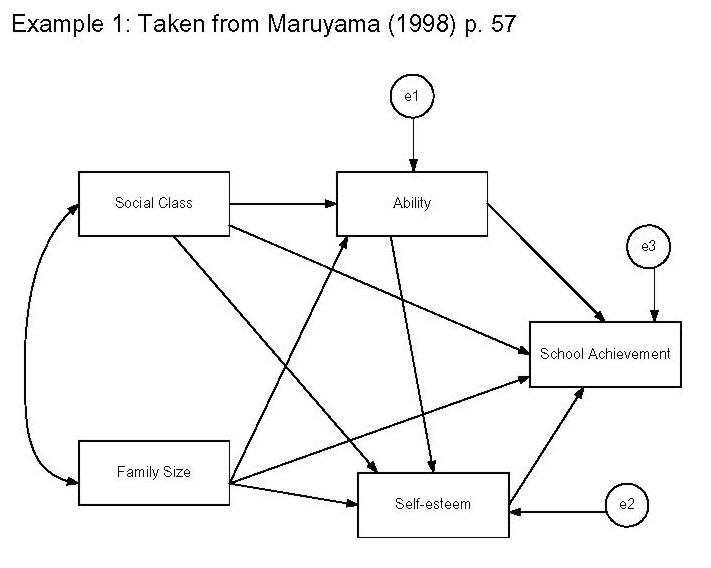
Correlation Matrix
class     1.00
famsize   -.33  1.00
ability    .39  -.33  1.00
esteem     .14  -.14   .19  1.00
achieve    .43  -.28   .67   .22  1.00
Do the indicated path analysis and interpret.
6.
Feb 10.
Discuss Data Adventures 2 and 3.
Continue
HLM details; BR text, HLM HS&B via random effects (mixed) models
Judith Singer HLM/PROC Mixed papers: Multilevel
Modelling Newsletter ; JEBS1998
Continue path analysis, structural equation models details and examples; Kline
text, Allison notes
Readings for Feb 17: Critical examination of Structural Equation Models [items
available at BlackBoard, ed260]
a. Breckler, S. J. (1990). Applications of Covariance Structure Modeling in Psychology:
Cause for Concern?
Psychological Bulletin, 107, 260-273.
b. Freedman, D.A. Structural
Equation Models: A Critical Review
Full
Book version Statistical Models: Theory and Practice
c. Rogosa, D.R. (1987). Casual models do not support scientific
conclusions: A comment in support of Freedman. Journal of Educational Statistics,
12, 185-195.
Rogosa, D. R., & Willett, J. B. (1985). Satisfying a simplex structure is
simpler than it should be. Journal of Educational Statistics, 10, 99-107.
Discussion: critique of structural equation models
Current event: Diabetes and child obesity, Causal-correlational farce?
California Center for Public Health Advocacy report
b. Holland-Rubin models for comparative experiments (causal inference)
Causal Inference, Path Analysis, and Recursive Structural Equations Models Paul W. Holland Sociological Methodology, Vol. 18. (1988), pp. 449-484.
Abstract Rubin's model for causal inference in experiments and observational studies is enlarged to analyze the problem of "causes causing causes" and is compared to
path analysis and recursive structural equations models. A special quasi-experimental design, the encouragement design, is used to give concreteness to the discussion by
focusing on the simplest problem that involves both direct and indirect causation. It is shown that Rubin's model extends easily to this situation and specifies conditions
under which the parameters of path analysis and recursive structural equations models have causal interpretations.
NOTE: this is a JSTOR link so it requires you to be on a Stanford IP machine (i.e. campus or campus dial-up or use proxy server)
Related technical reading
Statistics and Causal Inference, Paul W. Holland pp. 945-960 JASA 1986, another JSTOR link
Commentaries Donald Rubin, David Cox
Dead week mtg
Causal current event, folic acid and heart attacks
Student presentations, research papers
Causal current event: stents and heart attacks , value of experiments
intro and organization
Causal current event: music downloads and CD sales
instrumental variables analysis, Freedman stat151 book, chap 8
HLM review and discussion: B&R text chap 1-5.
Watching TV may hurt toddlers' attention spans Toddlers' TV viewing linked to attention deficit
Discussion student Research 4PM
Continue Instrumental variables, Freedman Chap 8.
Three-level HLM examples, B&R text Chap 8, SSI site
Student research projects
Non-linear Multilevel Models (counts and proportions)
RB text Chap 10 (logistic and Poisson link functions)
additional resources--
nlme (Bates-Pinhero book) Mixed-Effects Models in Practice lme for SAS PROC MIXED Users user guide
SAS NLMIXED sugi papers see SAS v9 docs on Ceras machines
Russell D. Wolfinger, SAS Institute Inc., Fitting Nonlinear Mixed Models with the New NLMIXED Procedure
16.
May 4.
Continue Non-linear HLM models and examples
Additional longitudinal examples
Basics of time1-time2 analyses, analysis of covariance, longitudinal HLM
applications (RB Chap 6)
1. data and analysis
examples LISREL, time1-time2 from
Rogosa, D. R. (1995). Myths and methods: "Myths about longitudinal research," plus
supplemental questions. In The analysis of change, J. M. Gottman, Ed. Hillsdale,
New Jersey: Lawrence Erlbaum Associates, 3-66.
data sets and some of
the associated output from
Rogosa, D. R., and Saner, H. M. (1995). Longitudinal data analysis examples with random coefficient models. Journal of Educational and Behavioral Statistics, 20, 149-170
More ecological regression: BIAS
IN ECOLOGICAL REGRESSION STEPHEN ANSOLABEHERE AND DOUGLAS RIVERS
non-Compliance in experiments and trials. Guest lecturer Booil Jo, Dept of Psychiatry
readings: Statistical Power in Randomized Intervention Studies With Noncompliance
also
Model misspecification sensitivity analysis in estimating causal effects of interventions with non-compliance
Estimation of Intrevention Effects with Noncompliance
18. May 18.
Propensity scores and adjustments.
The legacy of Rosenbaum & Rubin.
Readings from AERA Institute on Statistical Analysis 4/04
Paul Holland (Technical reading from March
2 class)
Statistics and Causal Inference, Paul W. Holland pp. 945-960 JASA 1986, another JSTOR link
Commentaries Donald Rubin, David Cox
Donald Rubin Nonrandomized Comparative Clinical
Studies
Original Technical Publications [jstor links]
Rosenbaum and Rubin, “Reducing Bias in Observational Studies Using
Subclassification on the
Propensity Score,” JASA 79[387], September 1984, 516-524. JStor
Rosenbaum, P. R. And D. B. Rubin, 1983, “The Central Role of the Propensity
Score in Observational
Studies for Causal Effects,” Biometrika 70[1], April 1983, 41-55. JStor
P. Rosenbaum, Chapters 2 and 3 (on exact inference for treatment effects) in
Observational Studies, New
York: Springer, 1995.
D. Rubin, “Comment: Neyman (1923) and Causal Inference in Experiments and
Observational
Studies,” Statistical Science 5[4], November 1990, 472-480. JStor
Rubin, D. B., 1974, “Estimating Causal Effects of Treatments in Randomized
and Nonrandomized
Studies,” Journal of Educational Psychology, 66, 688-701.
Rubin, D. B., Assignment to Treatment Group on the Basis of a Covariate,” Journal
of Educational Statistics 2[1], Spring 1977 1-26.
Rubin, D. B., 1978, “Bayesian Inference for Causal Effects: The Role of
Randomization,” Annals of
Statistics 6[1], January 1978, 34-58. JStor
Additional expositions and applications
Estimating
Causal Effects International J of Epidemiology
Propensity
Score Matching Medical Care
Reconciling
Conflicting Evidence on the Performance of
Propensity Score Matching
Practical Propensity Score Matching: A Reply To Smith
And Todd
Applications and graphics for propensity score analysis
Education Applications
Studying the Causal Effects of Instruction
With Application to Primary-School Mathematics
Using Multivariate Matched Sampling
That Incorporates the Propensity Score
to Establish a Comparison Group
POLISCI 353: Workshop in Statistical Modeling May 10
Paper:
Updating Voters: How cues and heuristics allow voters to act as if they are
informed
Some computing Implementations
SAS: SUGI 26: Reducing
Bias in a Propensity Score Matched-Pair Sample ..
Enhancements
to SAS/STAT Software
Propensity Score Method for Monotone Missing Data Example
9.2: Propensity Score Method
STATA Implementing Propensity Score Matching Estimators
with STATA
R/S-plus many programs available from individual authors
Artificial Data Examples: How well does this work?? handout5/18 further
exs 1 2
Educational application:
Principal Stratification Approach to Broken Randomized Experiments: A Case Study of School Choice Vouchers in New York City [pdf on bb.stanford.edu, Ed260]
Causal current event
Vigorous Exercise May Slow Women's Bone Loss Study: Earlier bone-booster use may limit osteoporosis
Continuing Topics. Followup on topics RB Chap 6, 10; selected topics RB Ch 11.
Student Research Projects
Causal Current event: Study: Driving longer means larger waists